Overview
Measure PM’s Clinical data reports provide detailed transparency over clinical data and related functions. These reports have been developed to help you make clinical decisions and view clinical summaries as part of your clinical workflow. This guide provides an overview of each clinical data report Measure PM offers, and outlines the purpose and details of each report as well as the permission required to access them.
How to access Reports
To access any report, the below permission will need to be granted. It will allow you access to the reports page, and from there, additional permissions are needed for each report to be accessible.

If the user has the required permission enabled, the Reports tab will appear in the left-hand menu within MPM. Selecting this tab will take you to the Reports page. From there, choose Data Reports and then select Clinical to view all clinical reports that your site currently has access to.

Clinical Data Reports
The clinical data reports consist of top-level filters, with the ability to filter further within the results grid. Once populated, they will all be exportable as both CSV and Excel files. Shown below is an example of the top-level filters. Any filter with a red asterisk is a mandatory field to fill out before being eligible to populate the report. Once required filters are fulfilled, select the Go button to populate the report.

Once the report is populated, you will see buttons to export in the top left-hand corner. Each report is populated with a similar format, and a scrollable table with blue column headers. Within each header you will see a funnel icon. To filter within the grid, select the funnel icon and search a keyword.

Within some reports, there will be blank and “-” value cells. Blank cells are indicators of there being no data within that column. In the example below you can see the Goal Definition column is blank, as that field was not filled out within the program configuration page at the time of the commit.

Cells that display a “–” indicate that there is no data available for that specific field. In the example below, the program includes committed duration data for its first data point, but does not display values in the frequency or task analysis columns because those measurement types are not applicable to that program.

ABC Data Report
This report shows all committed ABC data for a selected client profile. Each row represents an individually committed record.
To access this report the following permission is required:

Example of the ABC Data Report:

Appointment Summary Report
This report provides an overview of the number of trials, programs, and behavior incidents that were committed across rendered appointments. Each row in the report represents a separate appointment, and within each you can see the appointment details (i.e., date/time, provider, duration) along with the clinical data.
To access this report the following permission is required:

Example of the Appointment Summary Report:

Behavior Outcomes Report
This report allows users to view outcomes for client behavior based on selected measurement types (frequency, duration, latency, or intensity). It is used to evaluate trends in behavior reduction or increase over time by comparing the first data point, or average of first 3 data points, to the most recent data point, or average of most recent 3 data points. The report calculates changes across several metrics, including raw and percentage differences in behavior frequency, intensity, and rate and shows the difference between the first collected and most recently collected data.
To access this report the following permission is required:

Example of the Behavior Outcomes Report:

Behavior Plan Report
This report gives a quick glance at which clients have a behavior plan uploaded to their clinical profile. It’s used to track compliance with documentation standards, if required for a site, to ensure behavior plans are in place.
To access this report the following permission is required:

Example of the Behavior Plan Report:

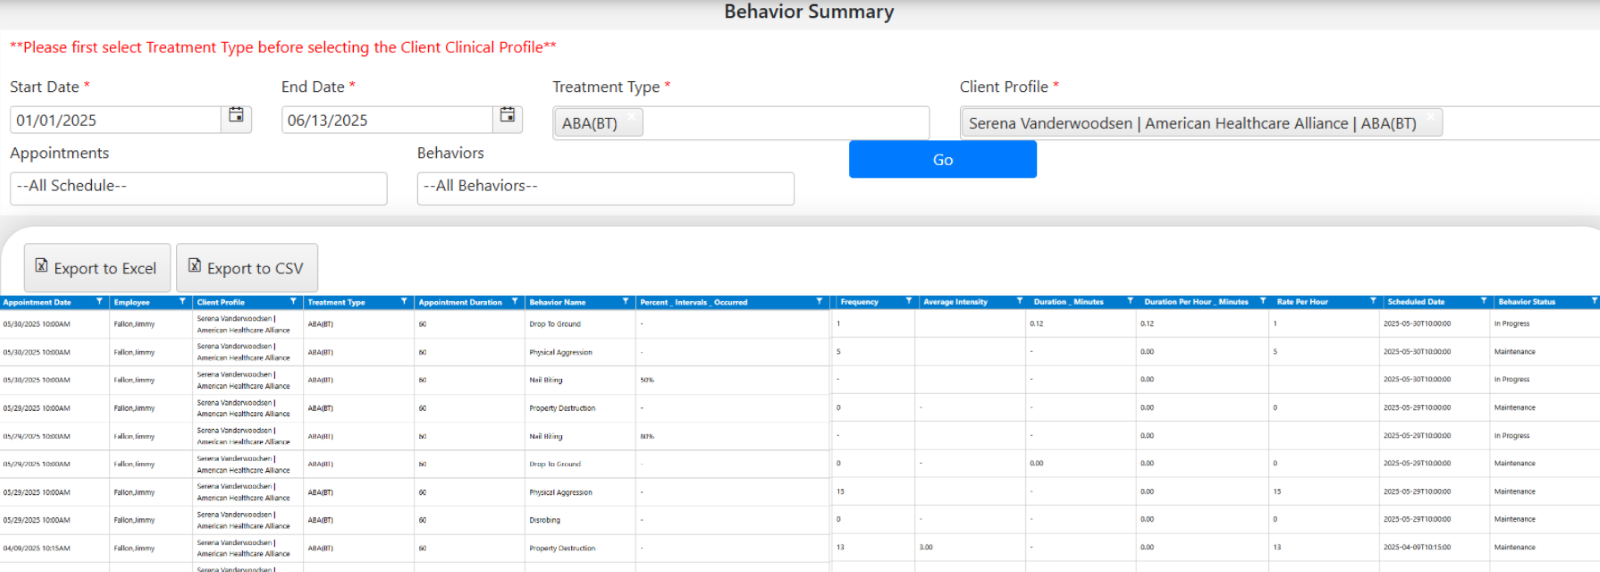
Behavior Summary Report
This report provides a summary of behavior incidents committed per client appointment. It’s used to review behavior trends with measurement types including frequency, duration, rate, intensity, and time sampling. Each row represents one appointment, and the behaviors committed during that session. The Rate Per Hour column is calculated by dividing the total frequency of the behavior by the rendered appointment duration in hours.
To access this report the following permission is required:

Example of the Behavior Summary Report:
Behavior Without Zero Commit Report
This report gives a list of appointments where frequency and duration-based behaviors do not have committed data. An appointment will appear in this report if all of the following conditions are met:
- The appointment falls within the selected start and end date range
- The client has at least one behavior goal that is in progress or maintenance phase
- No data was committed for that behavior during the appointment
- The commit at zero button was not used upon rendering
To access this report the following permission is required:

Example of the Behavior Without Zero Commit Report:

Clinical Data Edit Report
This report gives a detailed breakdown of all edits made to committed program data. Specifically, you will be able to see details of the appointment and original commit time, when edits occurred, who made edits and what the saved changes were. It can be used to audit data edits across your organization.
To access this report the following permission is required:

Example of the Clinical Data Edit Report:

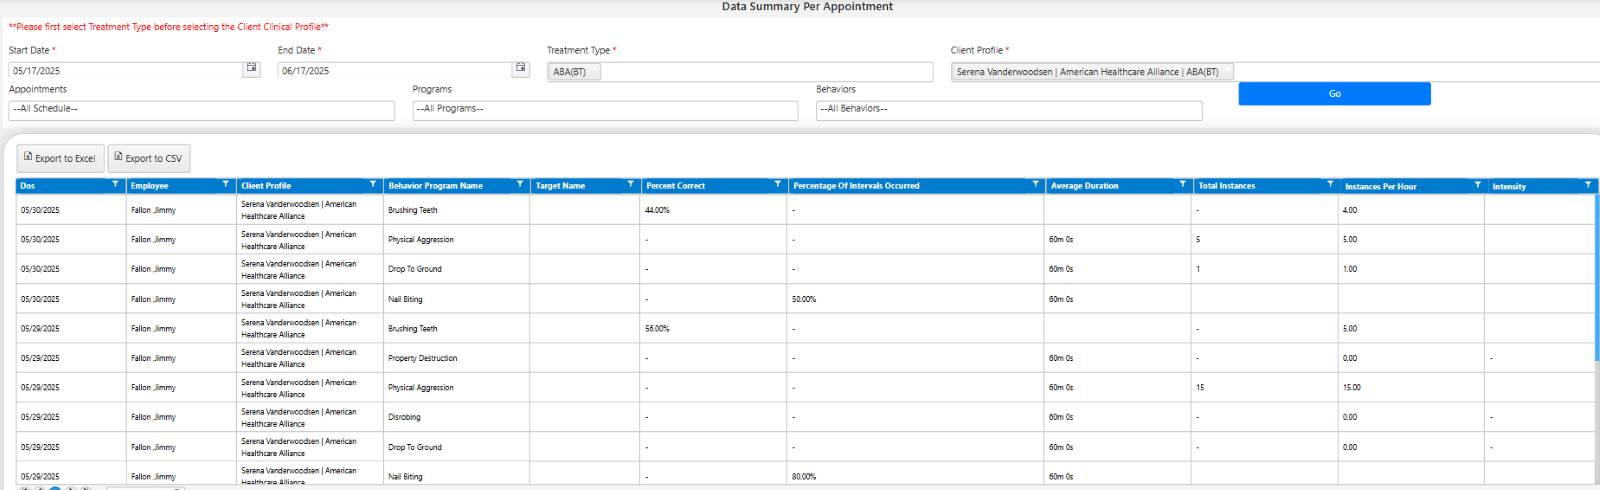
Data Summary Per Appointment Report
The purpose of this report is to give an overview of all committed program and behavior data within the filtered date range including columns such as the percentage of correct trials, average duration, total number of instances and intervals.
To access this report the following permission is required:

Example of the Data Summary Per Appointment Report:
Graphing Notes History Report
This report provides a list of all graphing notes that have been added to a client’s programs and behavior graphs. With this report, you can see who added the note, which appointment the note is associated with, and what the note type is. These notes are viewable on the web and mobile-app graphs as well.
To access this report the following permission is required:

Example of the Graphing Notes History Report:

Mastered Targets and TA Steps Report
This report displays a list of all program targets and task analysis (TA) steps that have been marked as mastered for the selected client within the chosen date range. It is used for providers to evaluate the pace of mastery across different programs. Each row reflects the individual skill or step that reached mastery criteria, along with the corresponding program name, initiation date (i.e., the date the target/step moved to In Progress status), mastery date (i.e., the date the target/step moved to Mastered status), instructional days (i.e., the number of days on which appointments were conducted), and instructional days run (i.e., the number of days on which the target/step was committed).
To access this report the following permission is required:

Example of Mastered Targets and TA Steps Report:

Program Library Report
This report gives a reference list of all programs available within a company’s site library. It displays an outline of each program, including the measurement type, domain, goal definition, instructional directions, and target bank or task step list.
To access this report the following permission is required:

Example of the Program Library Report:

Program Mapping Report
This report gives an overview of all programs mapped to a specific client profile. It can be useful for reviewing how often certain programs are used with each client. The report also shows details like the measurement type and current status of each program in the client’s profile.
To access this report the following permission is required:

Example of Program Mapping Report:

Program Outcomes Report
This report displays clinical outcome data for each program assigned to a client profile. It is used to evaluate progress by comparing the first recorded data point with the most recent data point across various measurement types, such as frequency, duration, rate, trials, and task analysis. The report includes raw and percentage-based differences to help evaluate changes in client performance.
To access this report the following permission is required:

Example of the Program Outcomes Report:

Program Summary Report
This report gives a summary of all program data committed across each scheduled appointment filtered within the date range, for a specified client. It displays each committed program and summarizes the trial counts and data for each.
To access this report the following permission is required:

Example of the Program Summary Report:

Program Target Notes Report
This report provides a view of all notes linked to specific targets within client programs at the time of commit. It allows users to review supervisor configured or provider-entered notes associated with committed data entries, offering insight into instructional directions or adjustments, client responses, or relevant session details. Records are only displayed for targets with committed data.
To access this report the following permission is required:

Example of the Program Target Notes Report:

Programs Not Committed Report
This report gives a breakdown of programs that are mapped to a client’s profile but do not have committed data during the selected date range.
To access this report the following permission is required:
Example of the Programs Not Committed Report:

Progress Report Details Report
This report displays the status and history of client progress reports within a selected date range. It includes information on the report name, status (draft or finalized), the staff member who created and finalized the report, and whether the report has been signed by a caregiver. This report is used to track documentation completion and ensure timely submission and approval of required reports.
To access this report, the following permission is required:

Example of the Progress Report Details Report:

Provider Instructional Trial Report
This report displays a list of instructional trials completed by a specific provider during each appointment within the selected date range. It includes data on the rendered session duration, the number of programs committed, and the total trials delivered. This report can be used to assess provider productivity and the level of clinical engagement across appointments.
To access this report the following permission is required:

Example of the Provider Instructional Trial Report:

Target/Task Step Status Report
This report provides a comprehensive view of the number of targets or task steps that fall within each status across all programs for a selected client. The report displays the program name, status, and total number of targets/steps per program. Then, taking it one step further, breaks down the number of targets/steps by phase, including Not Initiated, Baseline, In Progress, Maintenance, Generalization, Post Probe, Mastered, On Hold, and Discontinued. This report is used to evaluate client progress, identify where intervention is currently focused, and monitor skill acquisition and progression over time.
To access this report the following permission is required:

Example of the Target/Task Step Status Report:

Trial by Trial Report
This report provides a detailed breakdown of every instructional trial committed within a program, listed in the order they were recorded across selected sessions and clients. It is particularly useful for evaluating the consistency and progression of learner responses within a session. By reviewing trial frequency, response types, prompt levels, and error trends, users can assess whether the number of assigned trials is appropriate and identify areas where learners are showing the most success or encountering repeated errors. This information can guide data-based decisions when modifying program configurations to improve effectiveness of learner outcomes.
To access this report the following permission is required:

Example of the Trial by Trial Report:

VB-MAPP Usage Report
This report gives an overview of VB-MAPP assessment usage across clients. It’s used to view activation and deactivation dates of all VB-MAPP client flags and provide an indication of which clients currently have access to the assessment.
To access this report the following permission is required:

Example of the VB-MAPP Usage Report:

VB-MAPP Scores Report
This report displays the learner’s VB-MAPP scores across each domain. It reflects Milestone raw scores within each domain such as Mand, Tact, Listener Responding, etc. This report is used to quickly see scores across all VB-MAPP assessments that have been run and see the difference in scores from the first to the most recent assessment. These differences are used to monitor developmental progress over time.
To access this report the following permission is required:


For any additional comments or questions, please reach out to support@measurepm.com.