Overview
The purpose of this guide is to provide MeasurePM users with an overview of the software’s behavior data collection feature. This guide will walk users through accessing the data recording screens on the Mobile-App and how to record behavior data.
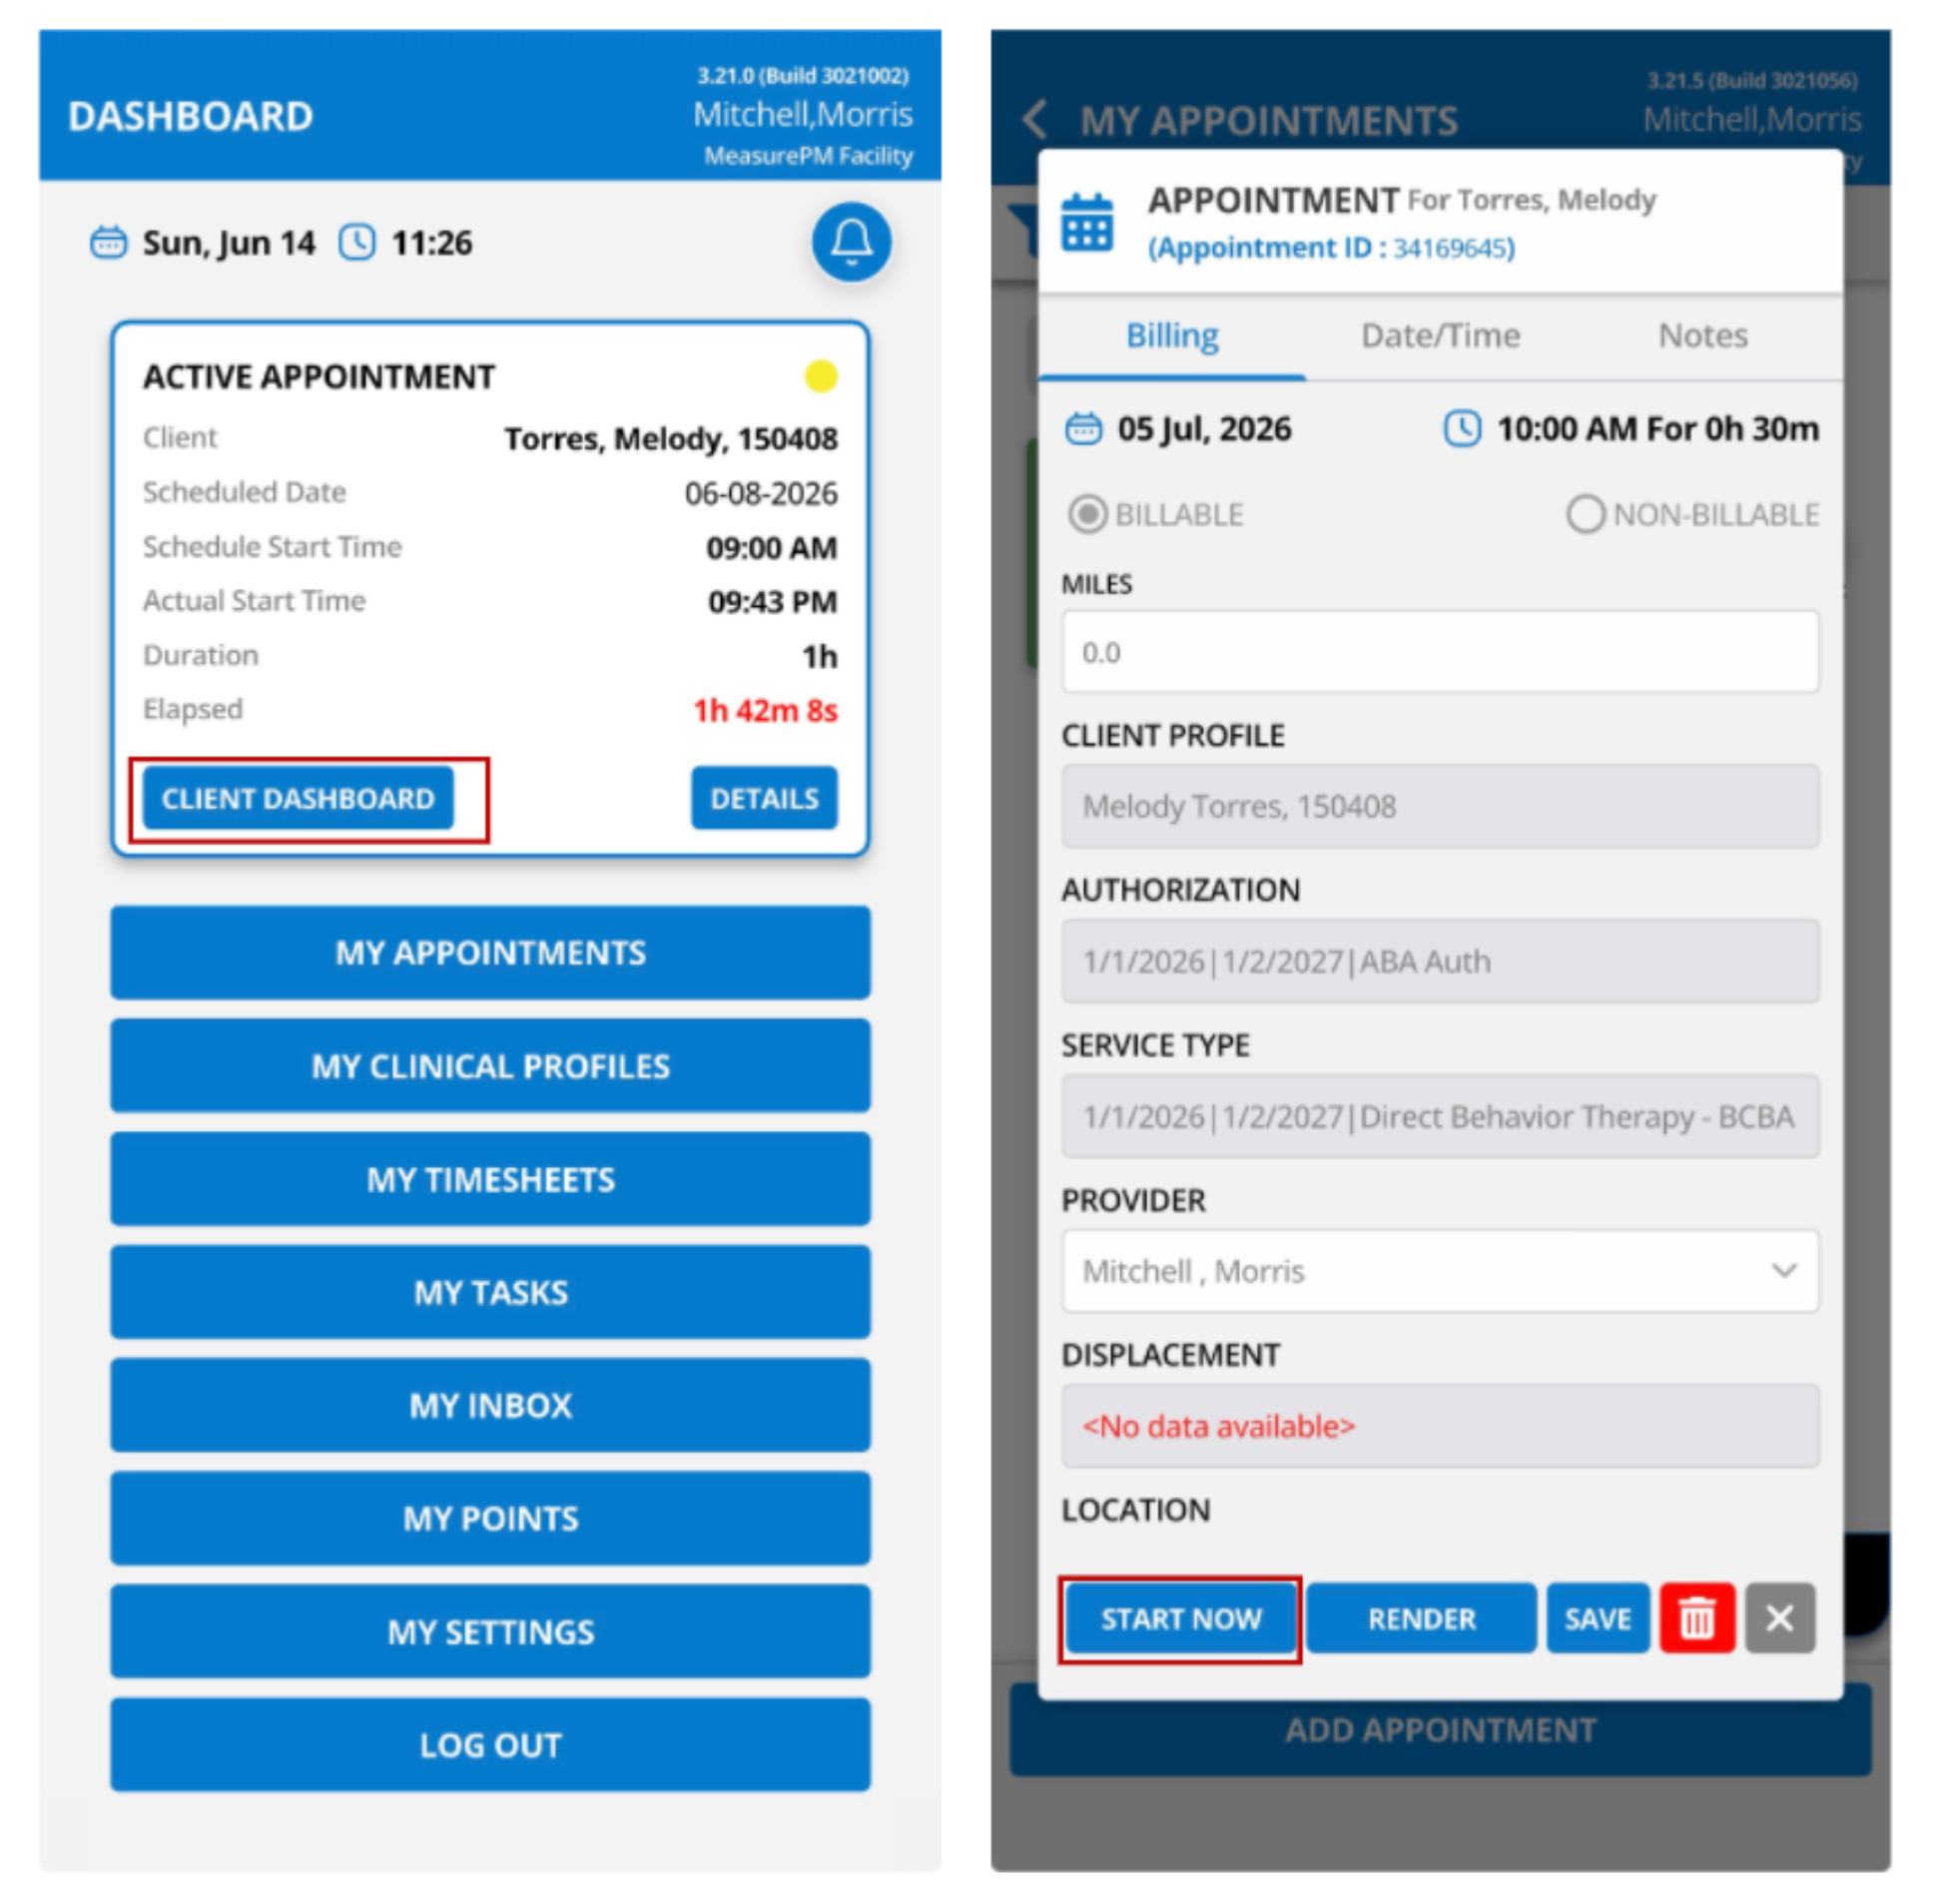
Please note, data collection can only occur for In Progress and Maintenance status behaviors and only within an active appointment. Therefore, when you log onto the Mobile-App, you must resume or start an appointment to access the data recording screens. To do so, select Client Dashboard (to resume an ongoing appointment) or Start Now from the appointment preview window on the Employee Dashboard.
Accessing Behaviors
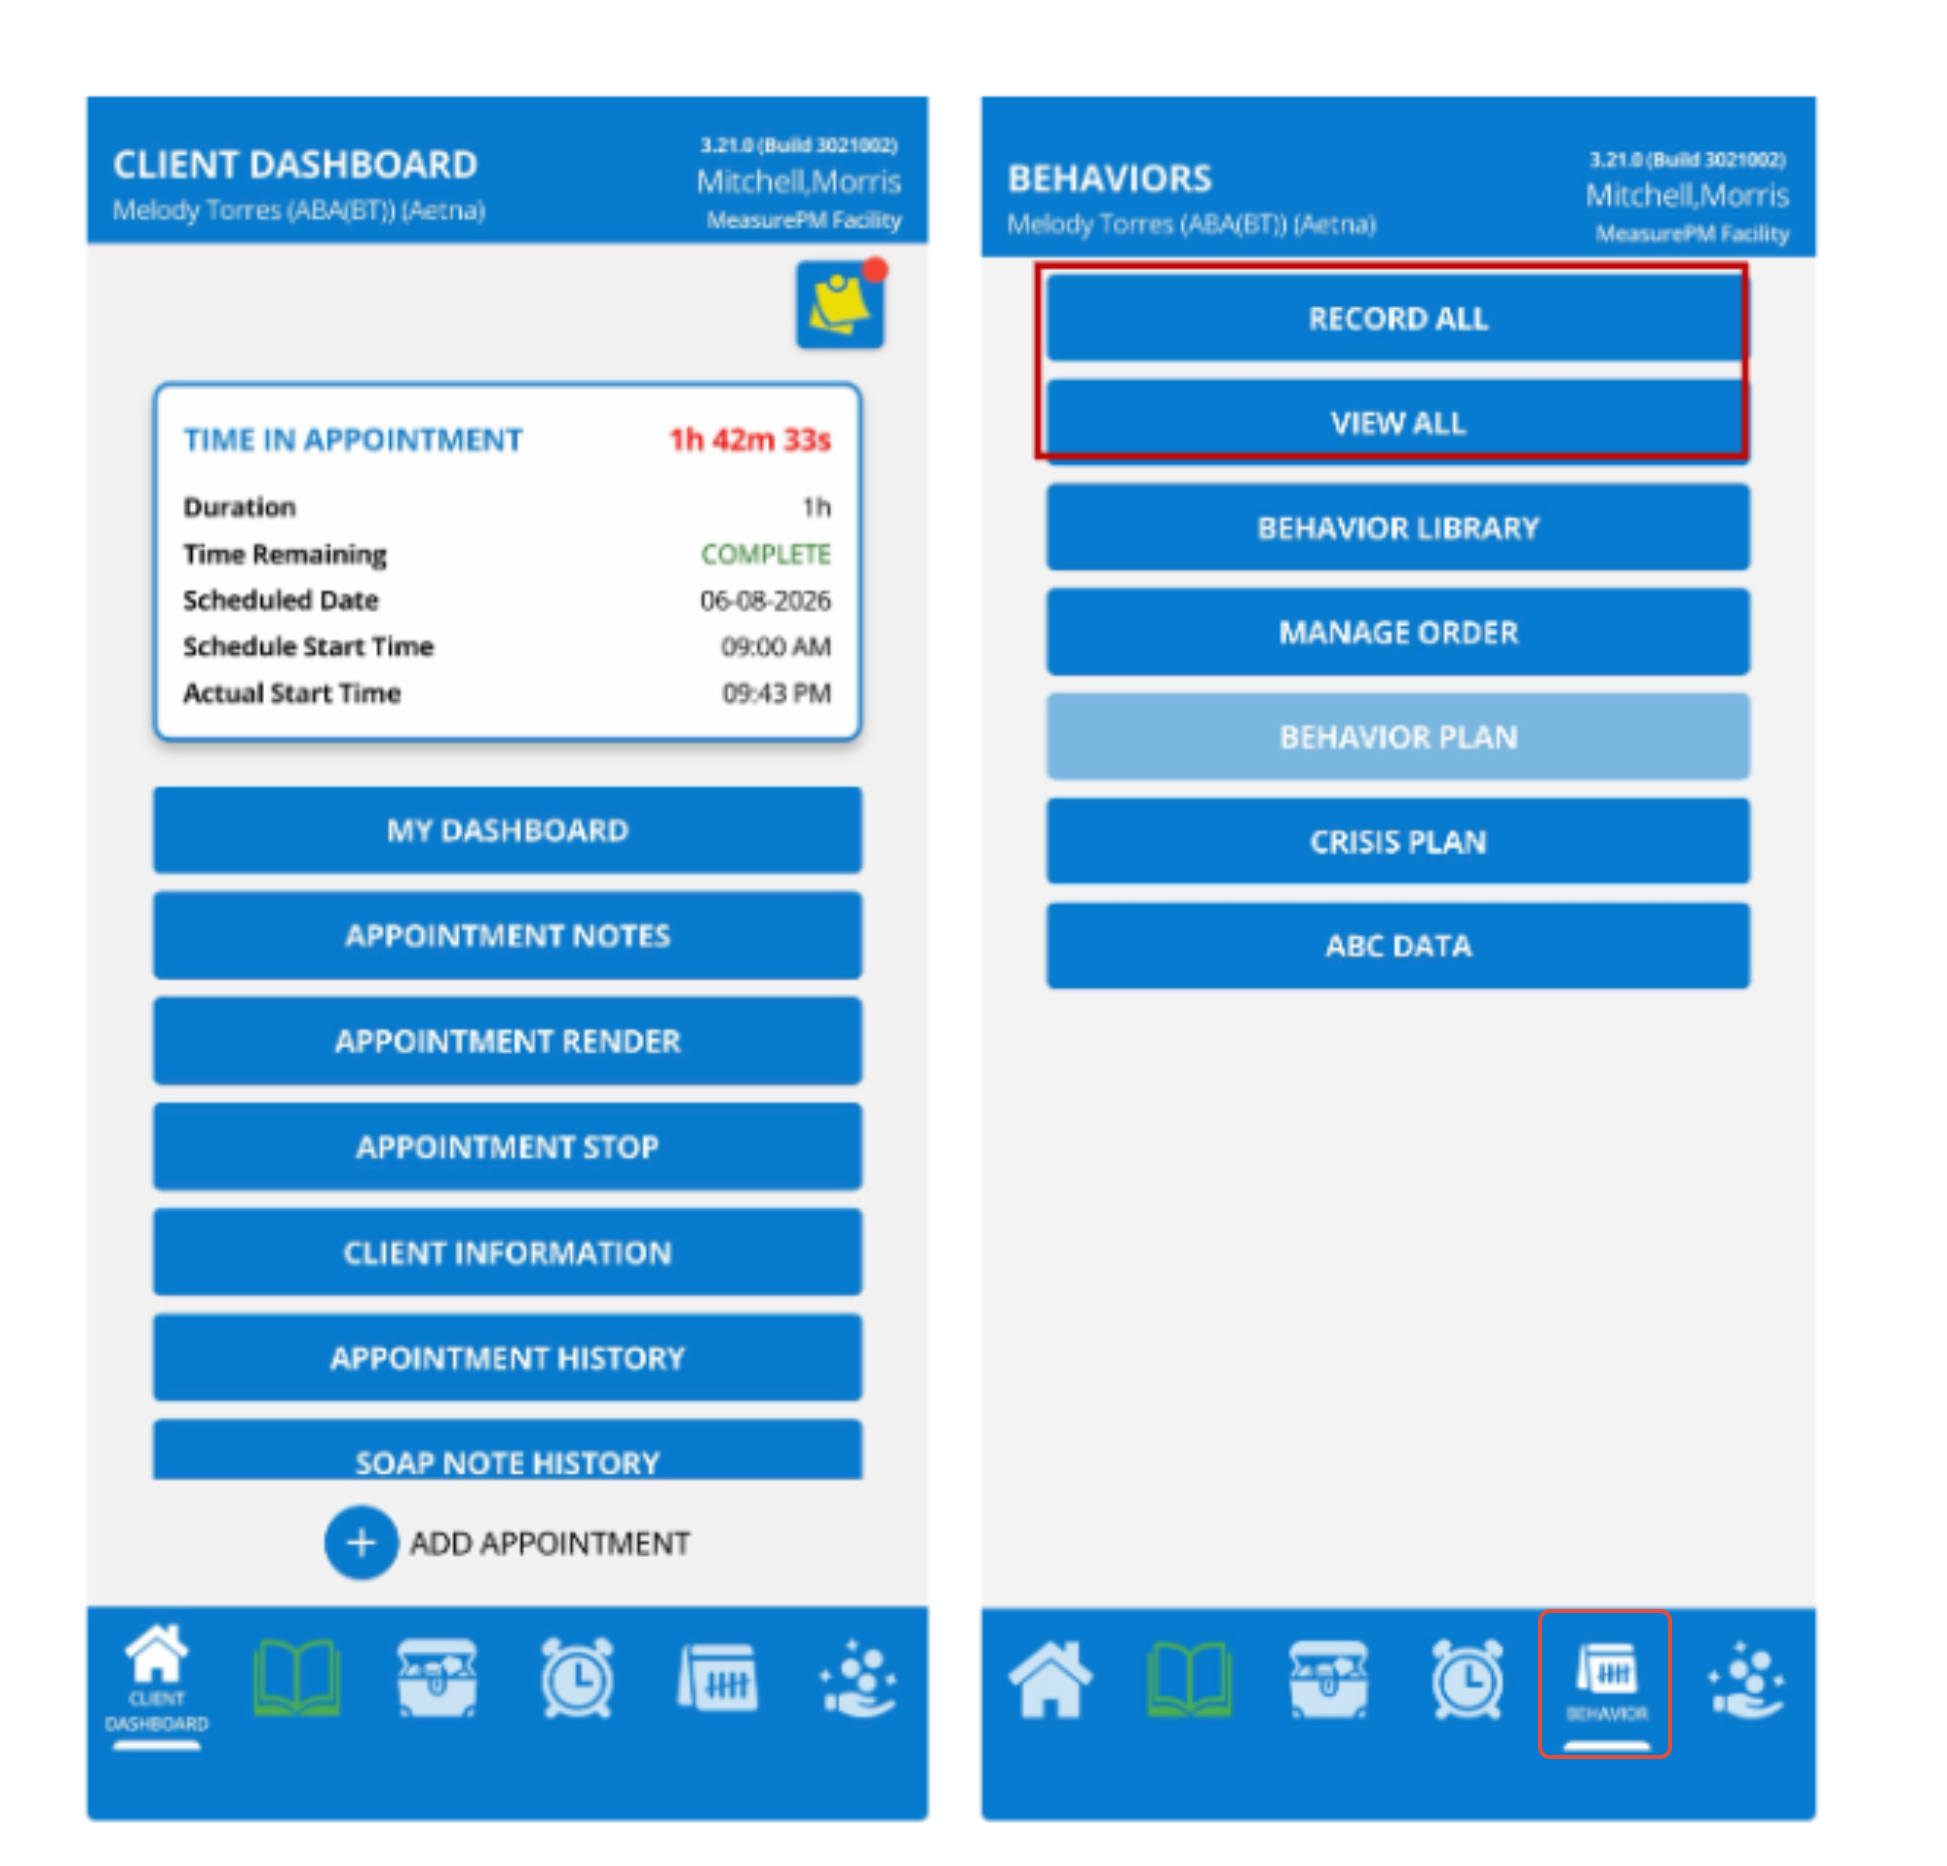
Once in an appointment, you will be brought to the Client Dashboard. From here you can navigate to behaviors by selecting the tally icon from the bottom navigation bar. Here, users can view each of the client’s target behaviors, access the Behavior Library, view Behavior or Crisis Plans, Record ABC Data, and view Conditional Probabilities. However, for the purpose of this guide we are only going to focus on the data recording features.
Recording Data
There are two ways to access the recording screen for a behavior, either by selecting Record All or View All, both of which are described below.
Record All
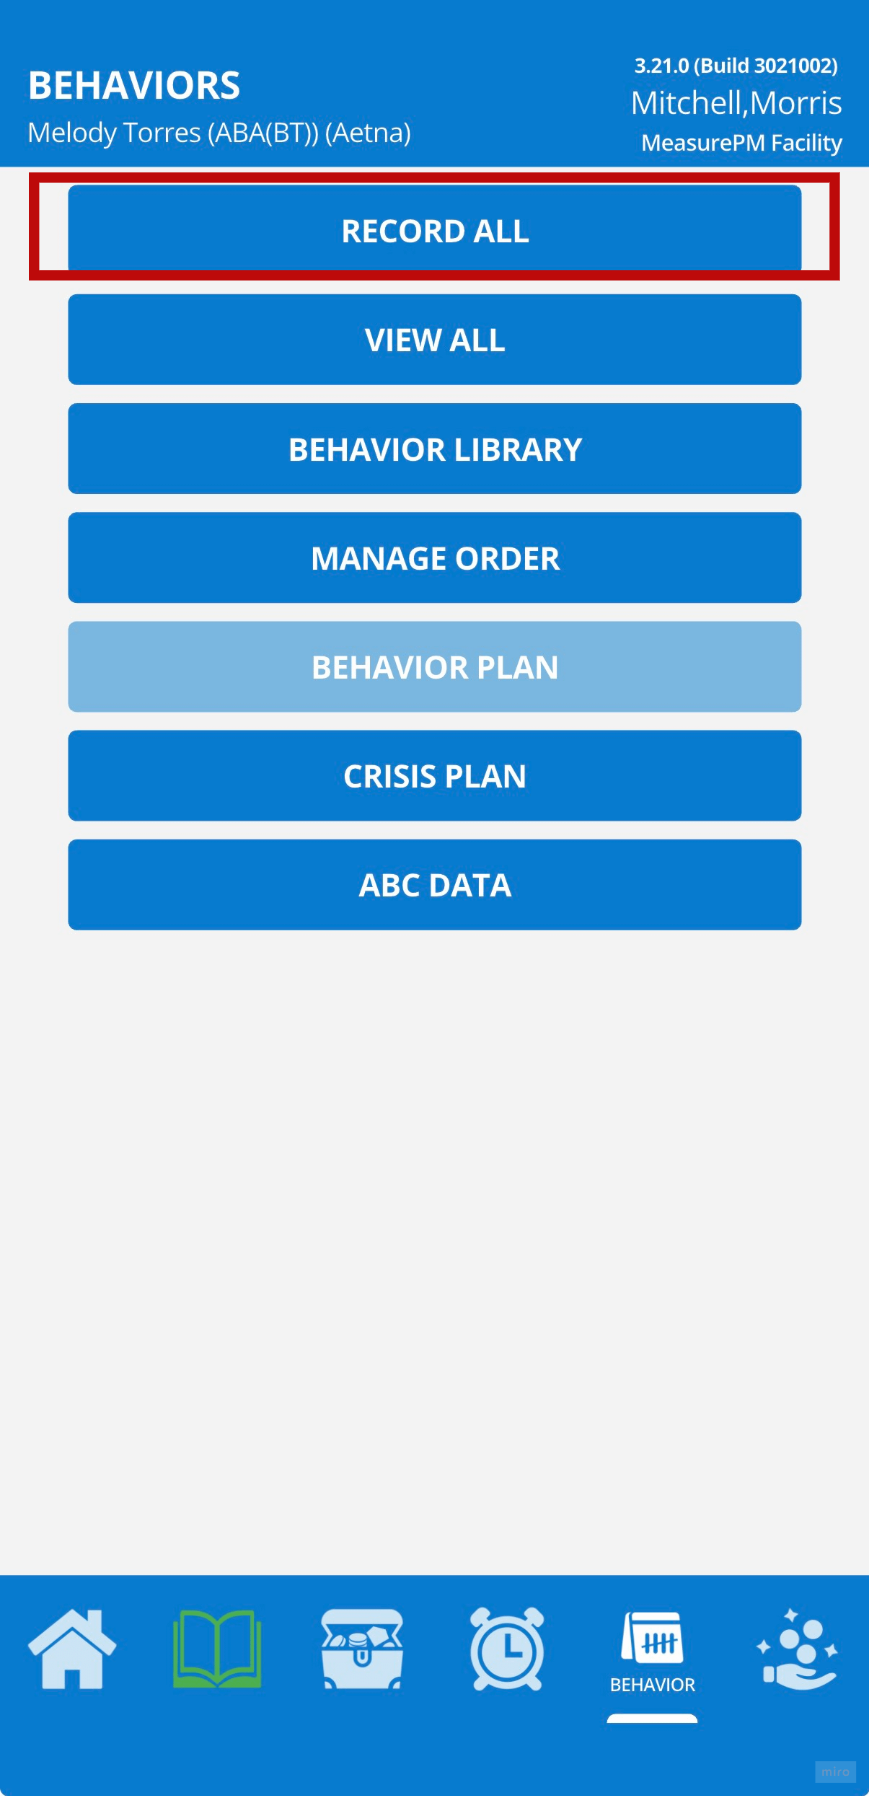
Select Record All to access the behavior recording screen for all Active behaviors. This option opens a scrollable behaviors page where users can quickly record multiple occurrences of behaviors at once.
The way the data is recorded will depend on the behavior measurement type and configurations.
- Behaviors configured with intensity: Select the – or + buttons to increase/decrease the intensity level.
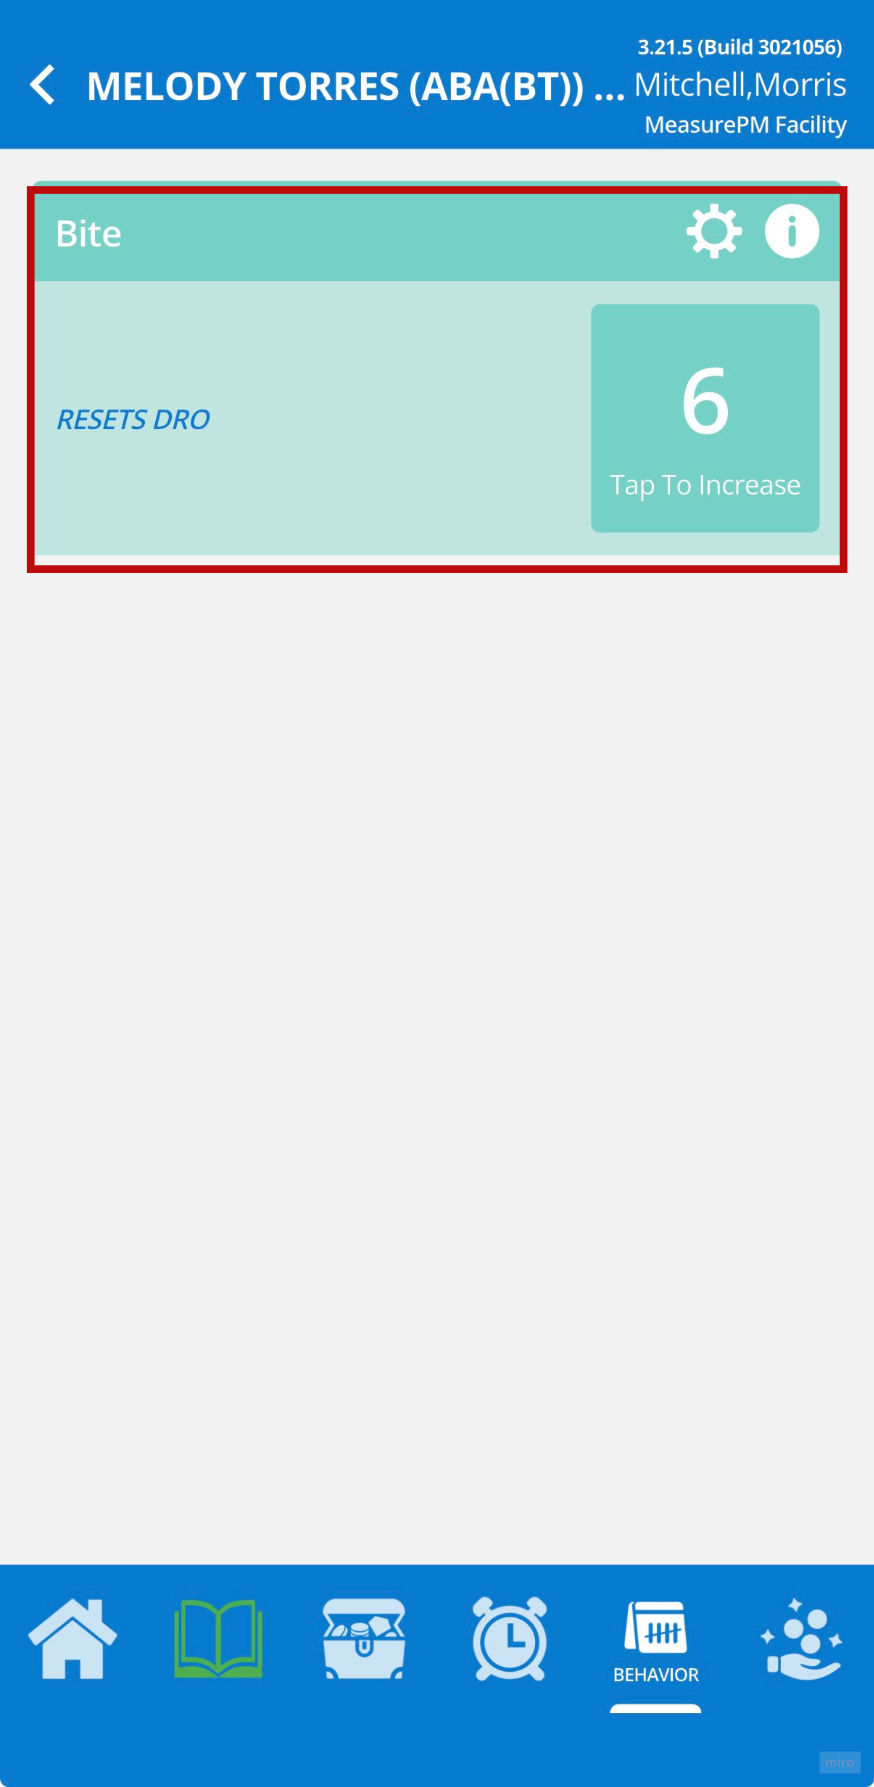
- Frequency based behaviors: Tap the number to the right side of the behavior to increase (to add an occurrence). If you need to add a large number of occurrences, hold down the number on the right side of the behavior for three seconds. This will then render a pop-up window where you can manually add occurrences (i.e., use the left and right toggle arrows OR type the number of occurrences into the textbox). If intensity is configured for that behavior, you can indicate an intensity by using the left and right toggle arrows. Once a value for occurrences, and intensity if it has been configured, has been added, select Ok. The occurrences added in "bulk" with be combined with the existing number of occurrences recorded. For example, if I have collected 5 occurrences but add 23 in bulk, the data collection screen will display a total of 28 occurrences of that behavior. If at any point you do not want to proceed with adding occurrences in bulk, simply select the Cancel button on the button lefthand side of the pop-up.


- Duration based behaviors: Select the play button below the timer to start tracking duration. Once started, a stop symbol will replace the play symbol. Use this to stop the timer. You can also restart a time by using the refresh icon or edit a time using the pencil icon. Beneath you can view the cumulative duration, and each instance of starting the timer will be recorded as a new instance. Therefore, frequency/occurrences will automatically be tracked for you as well.
- Time sampling-based behaviors: Select the play button below the interval timer, then you will see the interval begin to count down. When the interval elapses, you can record either a + (i.e., an occurrence) or a – (i.e., non-occurrence) for the interval. You are able to navigate away from the data recording screen when tracking time sampling behaviors. When the interval has elapsed, you will be prompted by a pop-up on the bottom navigation bar to record data, regardless of what screen you are on. You can stop the interval at any time with the pause button or refresh it with the refresh icon.

From this view, users are also able to easily access behavior settings by selecting the gear icon in the top lefthand corner.
- The ability to edit behaviors is permission based. If authorized, users can tap the field in which they would like to edit and make appropriate changes.
- Any item which the user does not have permission to edit, there will be a small lock icon beside it.
- If the user does have the permission, they can change the any of the available configurations: (i) Definition, (ii) Goal, (ii) Replacement Behaviors, (iv) Antecedent Strategies, (v) Consequence Strategies, (vi) Measurement Type, (vii) Reset DRO checkbox, (viii) Intensity checkbox and change the number of intensity levels, (ix) change interval (only if time sampling method is selected), and (x) Function(s) of Behavior.
- Regardless of permissions, all users will have the option to change the background color of the behavior by selecting on a color box in the editing screen.
- When finished editing, select the back arrow to return to the recording screen.
Additionally, from the Record All view users can quickly view operational definitions of the behavior by selecting the info (i) icon.

View All
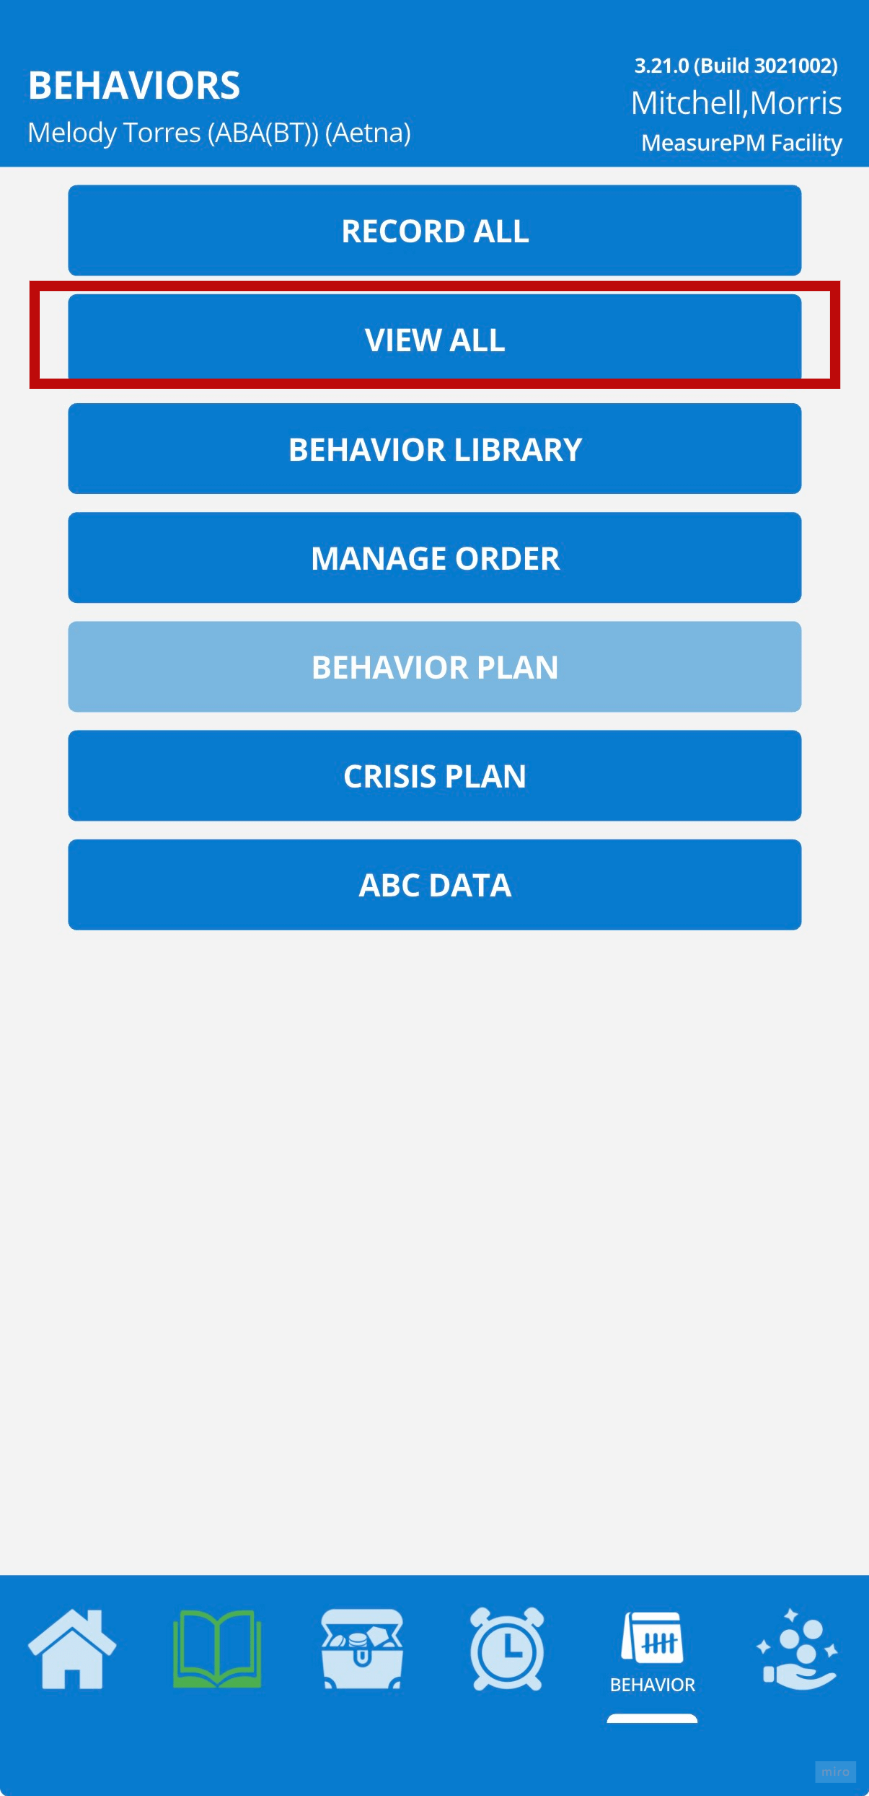
The second way to access the data recording feature is by selecting View All from the behavior menu.
This will open a list of all current behaviors organized by status. Users are able to view behaviors in alphabetical order or in custom order by selecting the corresponding radio button at the top of the screen and can maneuver between statuses by selecting the left and right blue toggle arrows. From here, users can select a behavior name to open the individual behavior menu. From the individual behavior menu, users can view the behavior definition, the measurement type, configure the behavior, view graph data or view committed data. If an In Progress or a Maintenance behavior is chosen, users can also opt to Record Data. Note, behavior statuses available in the Client Clinical Profile is based on the configurations made in Clinical Site Settings. For more information on behavior statuses, please refer to this guide.

If Record Data is selected, users will be brought to the individual recording screen for that behavior where they can record data, open the settings, and view the operational definition as on the Record All screen. Note, adding behavior occurrences in bulk can also be done on the individual recording screen by following the same steps (i.e., holding down the right side of the behavior for three seconds to render the pop-up).
Please note, if a behavior with any of the following statuses, Goal Met, On Hold, Discontinued, and Previous Goal, are selected, Record Data will not be available. Only In Progress and Maintenance behaviors are available for data collection.

Committing at Rendering
During the appointment, you will be able to record all behavior data. However, if you would like to commit the data at 0 (i.e., the behavior did not occur at all during the appointment), you can do so from the rendering screen by selecting Commit In Progress and Maintenance Behaviors at 0. If this checkbox is selected, all In Progress and Maintenance behaviors under the measurement type of Duration and Frequency for which no data were collected will be committed and graphed at 0.

For any additional questions or concerns, please reach out to support@measurepm.com