
Graphing Defaults allow your organization to define how newly created graphs display by default. Once configured, these settings are automatically applied to supported graphs throughout the MeasurePM Web App, including the Graphing Module and default graphs in Progress Reports. Individual graphs can still be edited and customized after they are created.
Important Note: Changes made on the Graphing Defaults page apply to the entire organization.
TABLE OF CONTENTS
- Accessing Graphing Defaults
- Graphing Default Sections
- Configure Program/Behavior Graph Defaults
- Configure ABC Conditional Probability Defaults
- Configure Cumulative Graph Defaults
- Where Graphing Defaults Are Applied
- Important Notes
Permissions
- No new permission is required to configure Graphing Defaults.
- Access to the Graphing Defaults page is controlled by the existing Clinical Settings permission.

If you do not see Graphing Defaults in the navigation menu, contact an administrator to confirm that you have the appropriate Clinical Settings permission.
Accessing Graphing Defaults
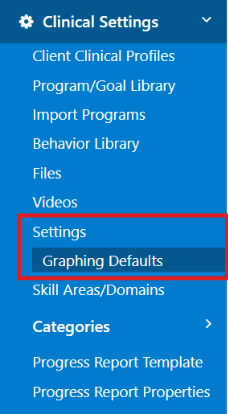
1. Log in to the MeasurePM Web App.
3. Select Graphing Defaults.
The Graphing Defaults page is available as a separate option in the left-hand navigation.
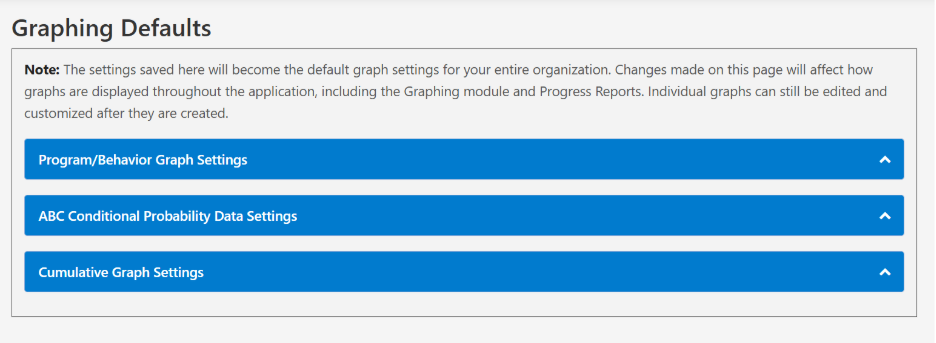
Note: The settings saved here will become the default graph settings for your entire organization. Changes made on this page will affect how graphs are displayed throughout the application, including the Graphing module and Progress Reports. Individual graphs can still be edited and customized after they are created.
Graphing Default Sections
The Graphing Defaults page contains three configurable sections:
- Program/Behavior Graphs
- ABC Conditional Probabilities
- Cumulative Graphs
Each section collapses when you first open the page. Expand the section you want to configure.
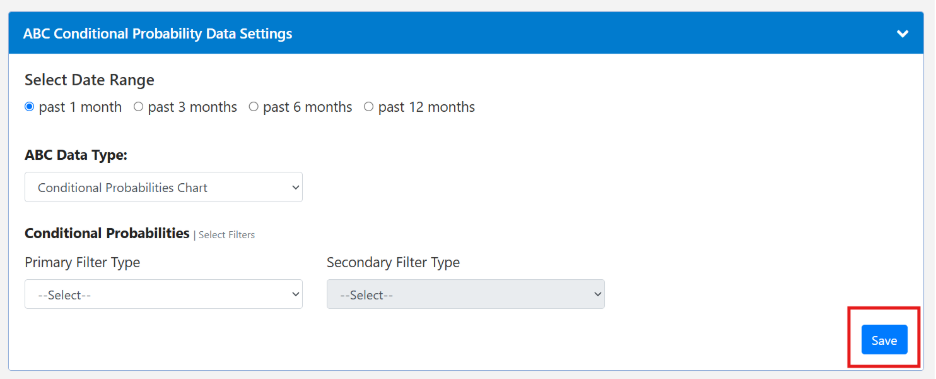
Each section has its own Save button, so changes are not saved before leaving the section, they will be discarded.
Configure Program/Behavior Graph Defaults
- Expand Program/Behavior Graphs to configure the default settings used when Program and Behavior graphs are created.
- The available options correspond to supported settings in the Graphing Module. Not every individual graph customization is available as an organization-level default.
- Depending on the graph type, available settings may include
- Date range
- Graph type
- X-axis type
- Program configuration
- Behavior configuration
- Target or Target/Step Status
- Location
- Provider
- Response Type
- Applicable Advanced graph options
- Axis configurations
- Legend configurations
Program Graph Filters
Depending on the setting, you can configure defaults such as:
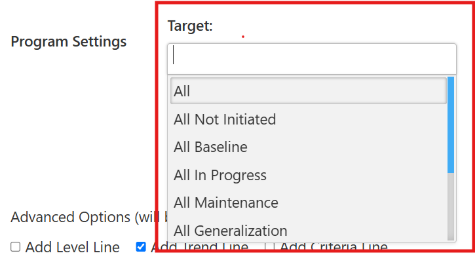
Target
Choose which targets should be selected by default. Options include:
- All: Selecting All creates one data series across all targets.
- Not Initiated
- Baseline
- In Progress
- Other available target statuses
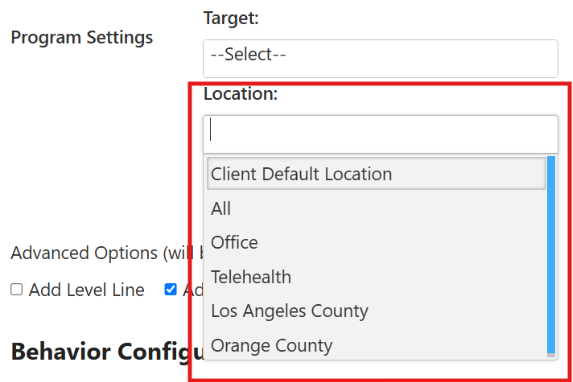
Location
Configure which locations should be included by default. Available options can include:
- All: Selecting All creates one data series across all locations.
- Client’s Default Location
- Locations configured in Site Settings
- Active Places of Service
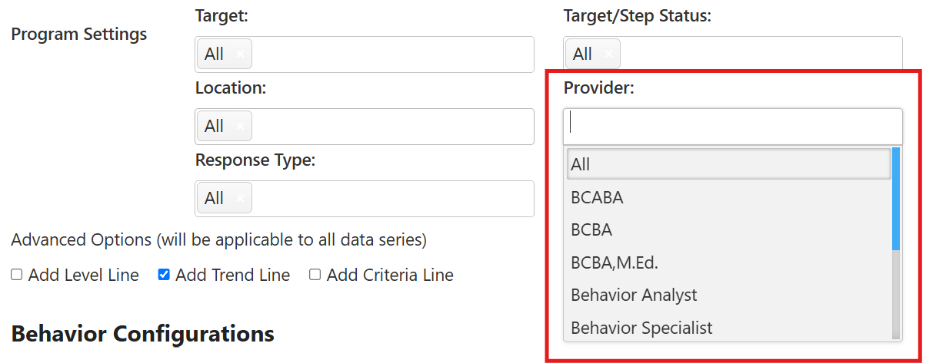
Provider
Choose the provider grouping that should be used by default.
Options include:
- All: Selecting All creates one data series across all providers.
- Employee types configured for your organization
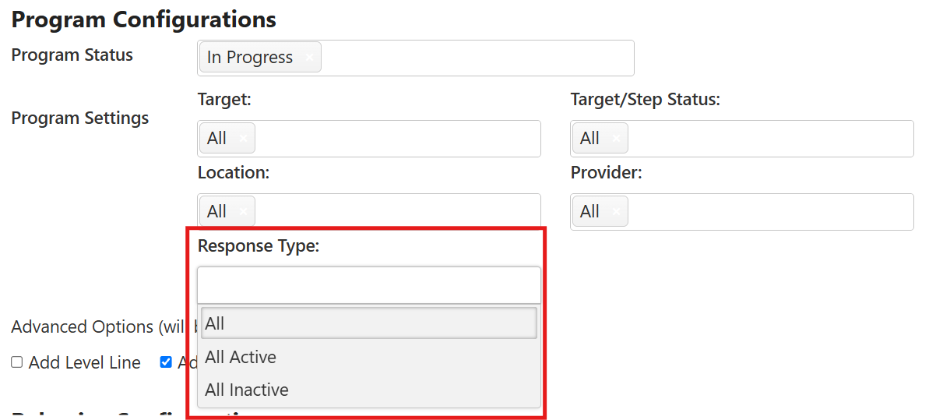
Response Type
For Program graphs, choose which response types should be selected by default.
Options include:
- All: Selecting All creates one data series across all response types.
- Individual active response types
- Individual inactive response types
Behavior Graph Filters
Program and Behavior graphs share applicable organization-level graph settings. Location and Provider defaults can also be configured for Behavior graphs.
Configure ABC Conditional Probability Defaults
Expand ABC Conditional Probabilities to define the default configuration used when an ABC Conditional Probability graph is created.
Available settings include the supported options displayed in this section, such as:
- Date range
- ABC Data Type
- Primary Filter Type
- Secondary Filter Type
Configure the available ABC graph options based on how your organization typically reviews conditional probability data.
When finished, select Save within the section. 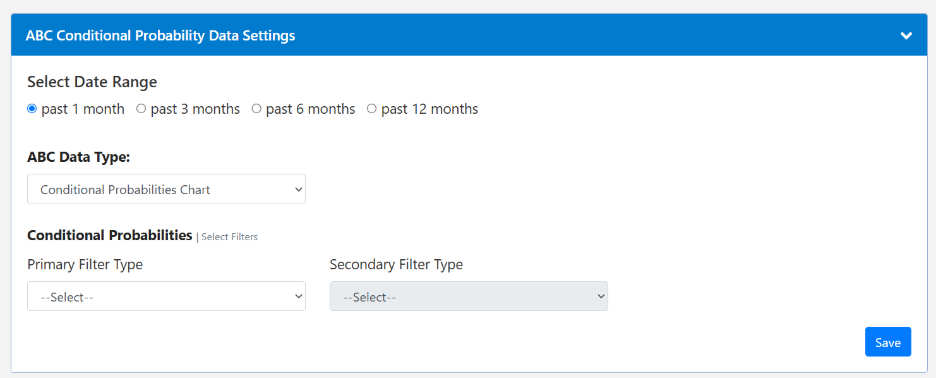
Configure Cumulative Graph Defaults
Expand Cumulative Graphs to configure how newly created Cumulative graphs should display by default.
Configure the available graph options based on your organization’s preferred view, then select Save. 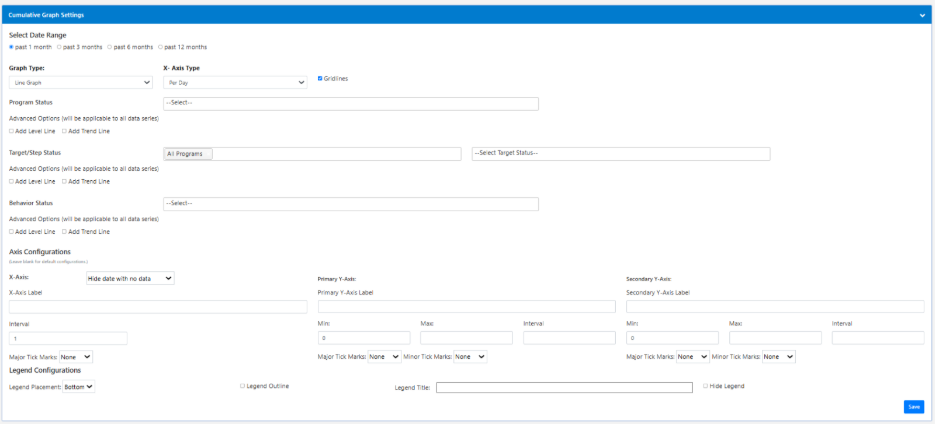
Where Graphing Defaults Are Applied
Saved Graphing Defaults are applied to newly created default graphs in:
- Graphing Module
- Progress Reports
For example, if your organization configures a particular Program graph view as the default, newly generated Program graphs will begin with those settings instead of the standard MeasurePM-level defaults.
These settings establish the starting configuration only. Users can still modify an individual graph after it has been generated.
For more information about automatically generated graphs in Progress Reports, see article: Default Graphs Populate in Progress Reports.
Important Notes
- Graphing Defaults are configured at the organization/site level, not for an individual client or provider.
- Changes affect newly created graphs that use supported defaults.
- Individual graphs can still be edited after they are created.
- Not every Graphing Module option can be configured as a site-level default.
- Settings such as custom graph titles, manually entered primary or secondary date ranges, and certain individual line styling options are not site-level defaults.
- This feature applies to the Web App. Mobile graph defaults are not changed by these settings.
For any additional questions or concerns, please reach out to support@measurepm.com