
Default graphs automatically populate in Progress Reports when the applicable Program or Behavior Reduction graph is included in the Progress Report template. This removes the need to manually add the initial graph for each Program or Behavior.
The graph uses your organization’s configured Graphing Defaults as its starting configuration and can still be edited after the Progress Report is generated.
Note: This article focuses on how default graphs work within Progress Reports. For instructions on setting up a report template or generating a report, see the related articles linked below.
TABLE OF CONTENTS
- Before You Begin
- How Default Graphs Are Added
- Edit a Default Graph
- Add Additional Graphs
- Graphing Defaults
- Important Notes
Before You Begin
A Progress Report template must be configured before generating a Progress Report.
For instructions on creating or updating a template generating and completing a Progress Report, see article: Progress Report Guide.
How Default Graphs Are Added
You do not need to manually select Add/Edit Graph to create the initial graph.

Edit a Default Graph
Default graphs provide a starting view, but they can still be customized within the Progress Report.
To edit a graph:
- Select the graph in the Progress Report.
- The Graphing Module opens.
- Update the graph settings as needed.
- Apply or save your changes to return to the Progress Report.
Existing graph-editing functionality remains available for graphs automatically populated in Progress Reports.
For more information about graph settings and customization, see article: Graphing Module – Web App.
Add Additional Graphs
The automatically populated graph is the initial graph for the Program or Behavior. You can still add additional graphs when needed.
To add another graph:
- Locate the applicable Program or Behavior in the Progress Report.
- Select Add Graph below the existing graph.
- Configure the additional graph.
- Add it to the Progress Report.
Multiple graphs can be added for the same Program or Behavior. 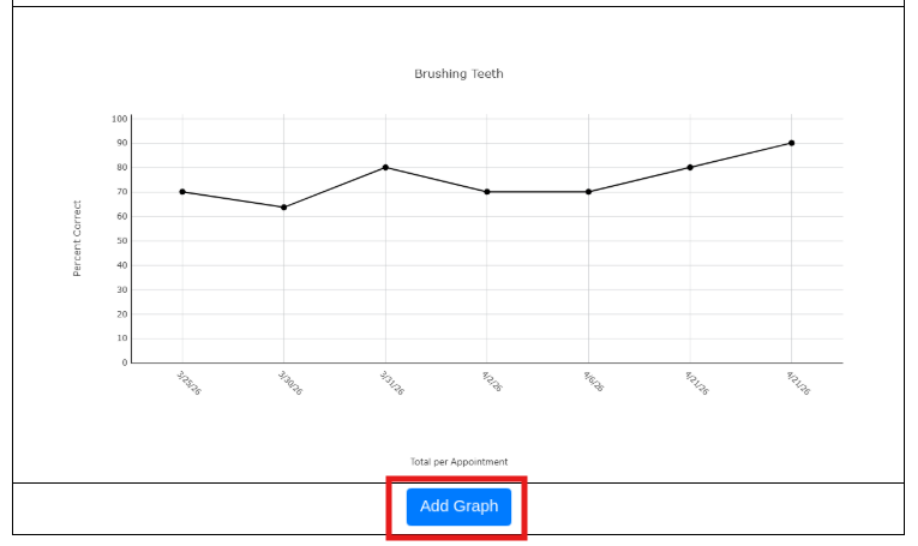
Note: Add Graph is used to add an additional graph. The initial default graph is automatically populated when the report is generated.
Graphing Defaults
Default graphs in Progress Reports use your organization’s configured Graphing Defaults as their starting configuration.
Graphing Defaults may control supported settings for:
- Program/Behavior graphs
- ABC Conditional Probability graphs
- Cumulative graphs
Individual graphs can still be customized after they are generated.
To learn how organization-level graph settings are configured, see article: Configure Graphing Defaults for Organization.
Important Notes
- The initial graph automatically populates when the applicable graph is included in the Progress Report template.
- When using custom Program or Behavior Reduction controls, the Graphs row must be included for the graph to display.
- Organization-level Graphing Defaults determine the starting configuration for supported graphs.
- Individual graphs can still be edited and customized.
- Add Graph remains available for adding additional graphs for the same Program or Behavior.
- This functionality applies to Progress Reports on the Web App. There are no mobile impacts for this feature.